Creation of Mech Priest Stats
Welcome to yet another log aggregation tool. For over a decade I have been using various scripts and jobs to collect and analyse Holy Priest raid data. For the last 6 or so years this data has been collected automatically in such a way I always have up-to-date data to query. This data is used regularly, to answer questions like:
- How efficient are people with their holy words?
- How do playstyles change between bosses?
- How does heroic compare to mythic?
- What unique items, buffs or spells are people using outside of the norm?
- And, probably most importantly, ever searching for "what have we missed?".
For Midnight my goal is to bring a selection of this data to people in a way they can consume it themselves. The goal is to let you tinker with the filters, alter the display of various metrics and explore yourself what I've been able to explore for years.
How it works
There are back-end processes that run to keep things up to date. The tl;dr is:
- The top 100 reports for each Spec, Difficulty and Encounter combination are kept up to date
- You can view these results filtering by Spec, Difficulty and Encounter
- You can either search for metrics to add and remove them, or use one of the pre-configured metric groups
- You can link the URL to someone else and they will see exactly what you see.
- Holy Priest is what the tool was built for and is maintained for, and has the most metric groups.
- Other healers have generic metrics that don't require detailed analysis.
- You can also import your own report to have it pinned at the top of the results, provided it has an encounter which matches your current filter If there is a metric you can't find or would like to see, reach out to me on Discord and I'll see if I can help.
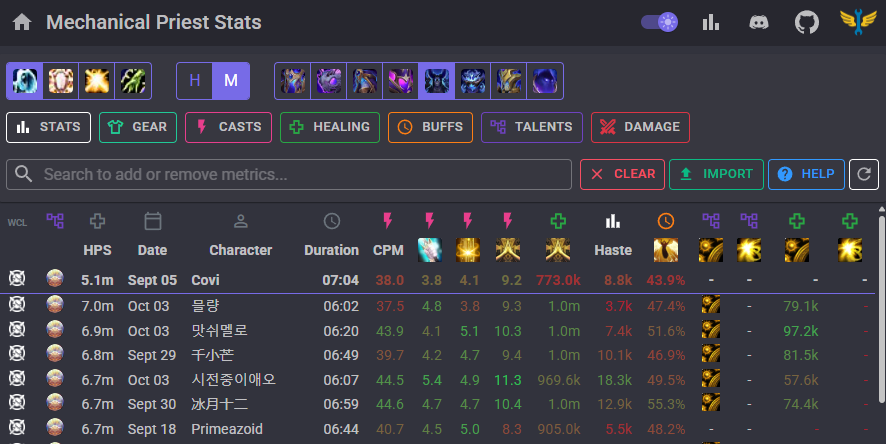
Navigation
The first section of buttons are filters, which filter the current view. You can specify which spec, difficulty and encounter combination you want to view results from. Only one combination can be viewed at once. To view multiple combinations side by side I suggest either multiple tabs or windows.

The second section are the pre-configured metric groups for this particular combination. Holy Priest has the most, as I naturally do more detailed analysis on this spec. The other specs have some generic metric groups that show the basics like CPM, HPS and buff uptime/PPM metrics.
![]()
The third section is a search bar which allows you to find metrics you care about, and properly customise the current view. Want to see how much of an impact Haste has on PoM CPM? Clear the current view then add Haste, PoM HPS, PoM CPM, Holy Word CPM and relevant talents. This customisation allows you to properly explore the data without having to open up dozens of Warcraft Logs windows at once.
![]()
To the right of the search bar is the Import feature. Using this will allow you to enter a Warcraft Logs report to the queue for analysis. Once processed (typically 10-20 seconds), you can choose to Load it. This will "pin" the results of any character in that report which matches the current Spec/Difficulty/Encounter difficulty you're currently viewing.
The final feature of note is the Help popup, which not only lists some of the technical details and limitations of the tool, but also explains some of the more complex metrics in case you aren't sure what they are for.
Results
Now you have your metrics setup, you need to make sense of the mess of numbers and icons in the results table. The top couple of rows show details about the metric that is displayed in that column.
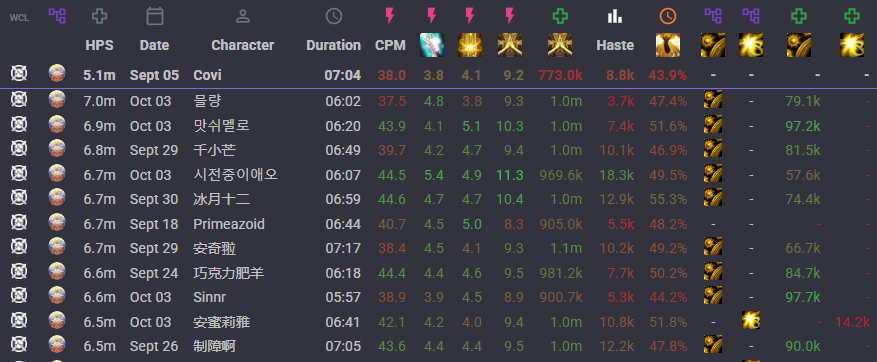
Typically metrics will have an icon that indicates a property of the metric, and other metrics with this common property will share this icon. Examples of this are the medical "+" icon for the HPS metrics.
The colour of each metric header relates to the group the underlying source of the metric belongs to. An example of this would be orange for all of the buff-related metrics.
It's hard to categorise most metrics just with a colour and icon, but hopefully they help visually parse the results you are seeing on screen once you become familiar with them. To further help with this, you can hover any coloured metric icon to view a tooltip which explains in more detail what the metric is displaying.
The only other item of note to mention from the results is the Warcraft Logs link to the left which navigates directly to the healing tab for that character.
Sharing
One of the most important features I've prioritised throughout development is the ability to share your view with others. As you change filters, add/remove metrics, or import a report - all of this gets added to the URL. Simply share the URL with someone and when loaded they will see what you see.